Dashboard Example
So, right now, you know how to create panel, charts KPI and data table… On the “Testing1” dashboard, you have login/logout, menu and data table menu. Let’s try to add some charts on to the dashboard.

1. Click on “Create a new panel in current page”

2. Select “Key Performance Indicator” => drag “Create panel”

=> and drop to the bottom => “COL_1”

3. Select “mysql_sales”

4. Select Pie chart with below values.
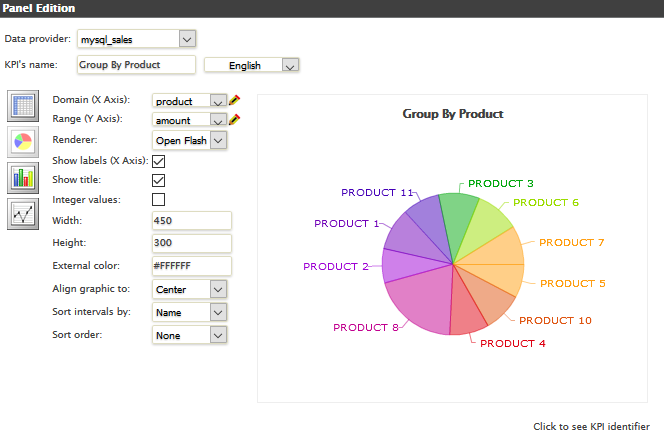
5. Click ![]() besides “amount”, select “Sum” and click “Save”:
besides “amount”, select “Sum” and click “Save”:

6. Close the Panel Editor, and the new KPI panel will be shown on the “Testing1” dashboard.

Let’s create another two charts on the bottom => “COL_2” and “COL_3”. Select “mysql_sales” for these new charts.
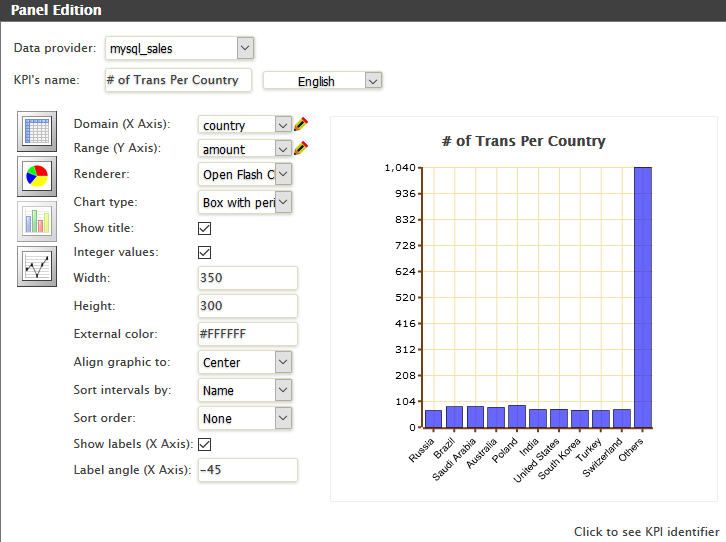
“COL_2”: Select “Bar chart”, input the below values, Click![]() besides “amount”, select “Count” and click “Save”:
besides “amount”, select “Count” and click “Save”:
“COL_3”: Select “Line chart”, Input the below values, Click ![]() besides “amount”, select “Sum” and click “Save”:
besides “amount”, select “Sum” and click “Save”:

Now, your dashboard is almost done. Let’s see how to “Filter and Drill-Down Data”.


