Filter and Drill-down Data
With filter and drill-down features, you can have an in-depth and detail understanding on your data.
Let’s create a filtering panel on the left under the menu:
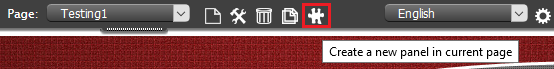
1. Click on “Create a new panel in current page”
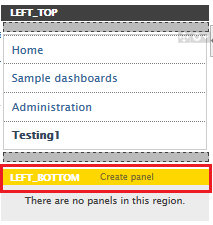
2. Select “Key Performance Indicator” => click “Dashboard” => then “Filter & Drill-down” => drag “Create panel”

=> and drop to “LEFT_BOTTOM” under the menu
3. Click on ![]() , and select “Edit content”
, and select “Edit content”

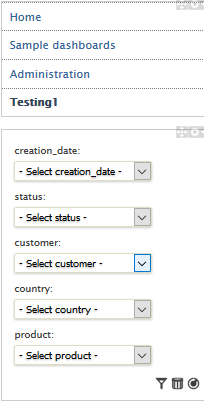
4. Select “creation_date”, “status”, “customer”, “country” and “product”:

If you want the dashboard auto-refresh, you can enable this option
![]()
5. Now, you have the filtering menu on the left:
Let’s select “Australia” for the country, and see what is happening… all KPIs refresh, and you can see only “Australia” data.

How to reset the filter? You can click on ![]() to reset the filter.
to reset the filter.

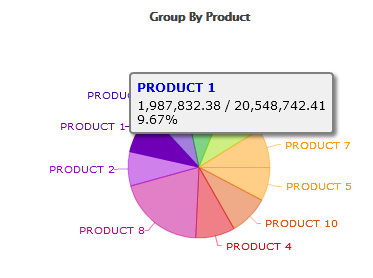
Besides using the filtering menu, you can also click on any value of the charts or data table to drill-down the data. Let’s click on “PRODUCT_1” of Group By Product chart, all KPIs refresh.
And then let’s click on “CONTRACTED” on the data table:

So, you can keep on drilling down the data until finding some valuable results.
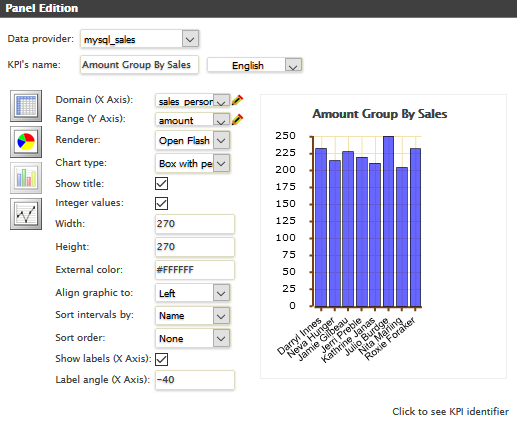
You can also create a filtering chart on the left under the filtering menu like:

Simply using the below values to create this filtering chart KPI:
Cong!!! your dashboard is done, and become:
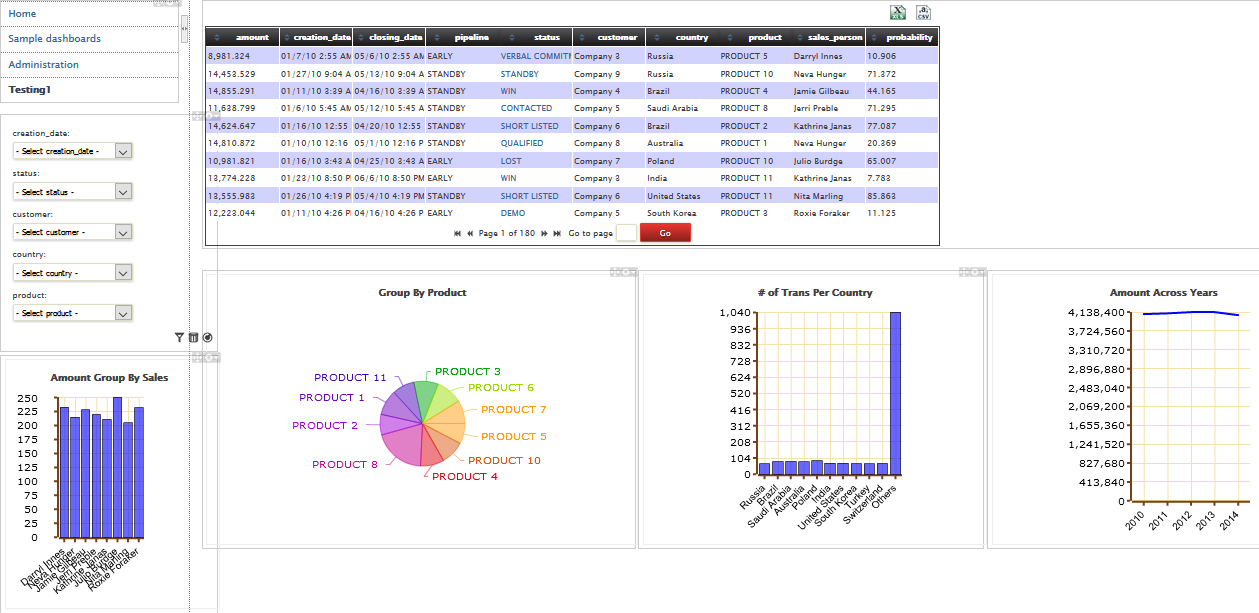
After walking through the blogs, you will find that Dashbuilder is so simple to use, and you can create a new dashboard without any coding with great features, such as exporting, chart, data table and filtering.
A new version called UF Dashbuilder is under development with more great features, more powerful chart library, you can find more details from http://www.dashbuilder.org/ufdashbuilder.html .


